File:Hill-Langmuir equation plot.png
No higher resolution available.
Hill-Langmuir_equation_plot.png (768 × 406 pixels, file size: 144 KB, MIME type: image/png)
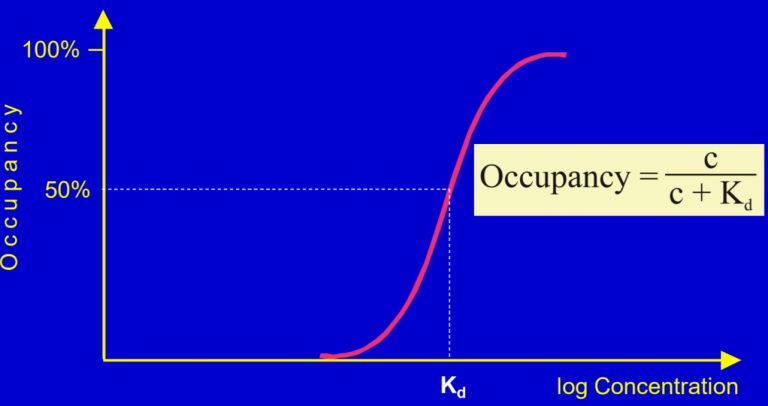
This graph shows what the Hill-Langmuir equation looks like if you plot it. The x axis is the logarithm of the concentration of the drug (meaning that this is a logarithmic scale), while the y axis is the percentage of all receptors that are occupied by a ligand.
File history
Click on a date/time to view the file as it appeared at that time.
| Date/Time | Thumbnail | Dimensions | User | Comment | |
|---|---|---|---|---|---|
| current | 15:19, 10 March 2023 | | 768 × 406 (144 KB) | Nikolas (talk | contribs) |
You cannot overwrite this file.
File usage
The following page uses this file: