File:Price-Jones curve.png

Size of this preview: 574 × 600 pixels. Other resolution: 980 × 1,024 pixels.
Original file (980 × 1,024 pixels, file size: 865 KB, MIME type: image/png)
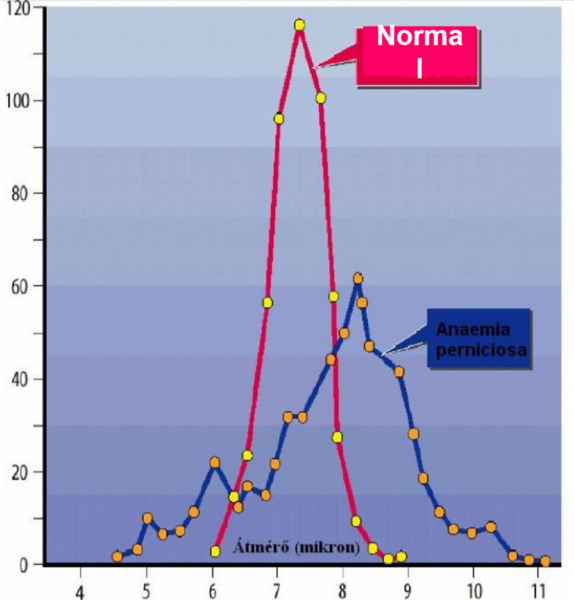
A Price-Jones curve. The x-axis shows the diameter of the RBCs in micrometres. The y-axis shows the number of RBCs. This figure shows the situation for healthy people (red) and for pernicious anaemia (B12 deficiency anaemia) in blue.
File history
Click on a date/time to view the file as it appeared at that time.
| Date/Time | Thumbnail | Dimensions | User | Comment | |
|---|---|---|---|---|---|
| current | 20:23, 13 December 2022 | | 980 × 1,024 (865 KB) | Nikolas (talk | contribs) |
You cannot overwrite this file.
File usage
The following page uses this file: