File:Plasma concentration over time after first order elimination.png

Size of this preview: 570 × 600 pixels. Other resolution: 768 × 808 pixels.
Original file (768 × 808 pixels, file size: 278 KB, MIME type: image/png)
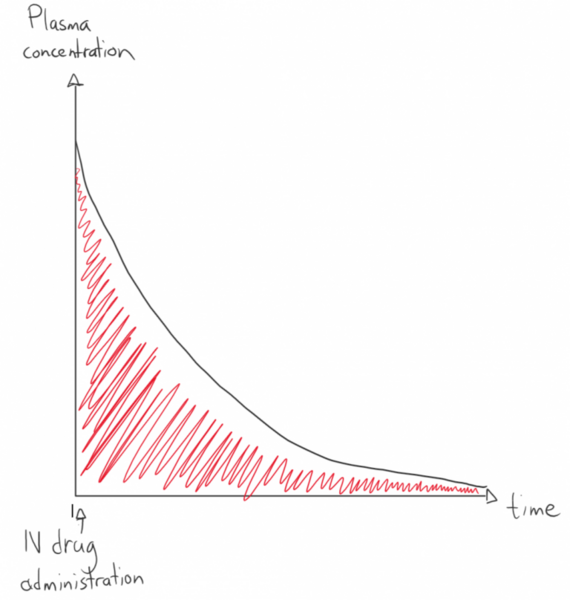
This graph shows how the plasma concentration changes with time after administration of a drug intravenously with first order elimination. The red area is the area under the curve.
File history
Click on a date/time to view the file as it appeared at that time.
| Date/Time | Thumbnail | Dimensions | User | Comment | |
|---|---|---|---|---|---|
| current | 14:21, 16 March 2023 | | 768 × 808 (278 KB) | Nikolas (talk | contribs) |
You cannot overwrite this file.
File usage
The following page uses this file: