File:Plasma concentration of substances related to GFR.png
No higher resolution available.
Plasma_concentration_of_substances_related_to_GFR.png (768 × 526 pixels, file size: 206 KB, MIME type: image/png)
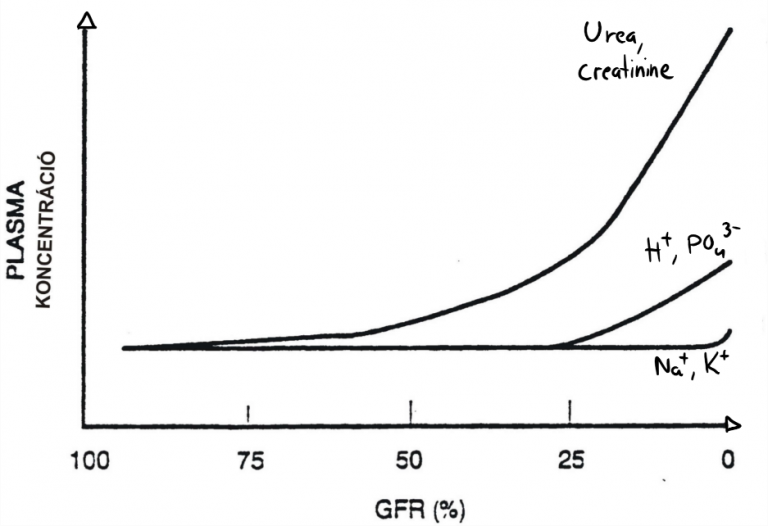
This graph shows the plasma concentration of different substances in correlation with the GFR. From this figure we can understand that hypernatraemia and hyperkalaemia only occurs when GFR is almost zero, while azotaemia (urea and creatinine in blood) occurs already when GFR drops to half its normal value.
File history
Click on a date/time to view the file as it appeared at that time.
| Date/Time | Thumbnail | Dimensions | User | Comment | |
|---|---|---|---|---|---|
| current | 18:53, 17 February 2023 | | 768 × 526 (206 KB) | Nikolas (talk | contribs) |
You cannot overwrite this file.
File usage
The following 2 pages use this file: