File:Occupancy-response plot.png
No higher resolution available.
Occupancy-response_plot.png (768 × 458 pixels, file size: 201 KB, MIME type: image/png)
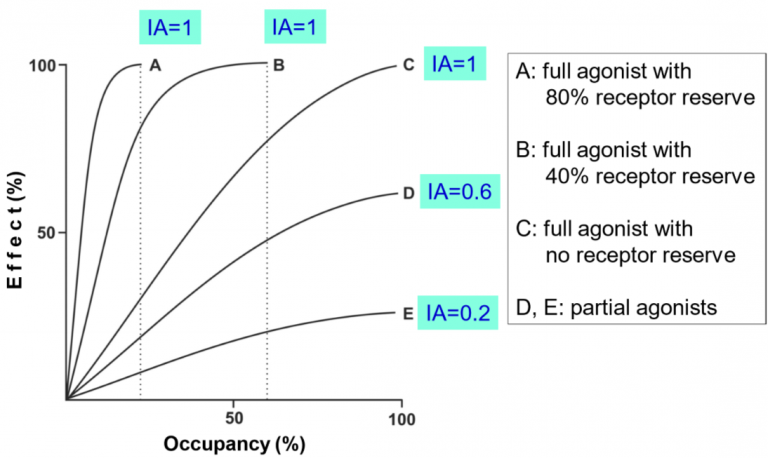
A, B, C, D and E are different drugs. Details about them are in the table.
File history
Click on a date/time to view the file as it appeared at that time.
| Date/Time | Thumbnail | Dimensions | User | Comment | |
|---|---|---|---|---|---|
| current | 15:21, 10 March 2023 | | 768 × 458 (201 KB) | Nikolas (talk | contribs) |
You cannot overwrite this file.
File usage
The following page uses this file: