File:Drug-response curve.png
No higher resolution available.
Drug-response_curve.png (768 × 440 pixels, file size: 85 KB, MIME type: image/png)
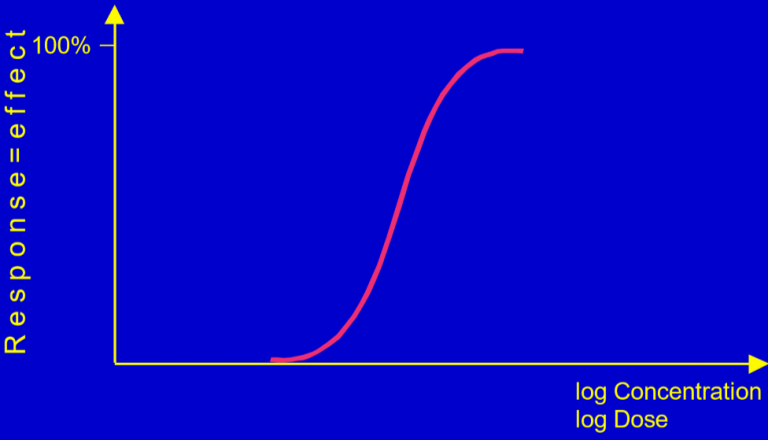
A drug-response curve. The x-axis is the drug dose while the y-axis is the fraction of patients that reached the target clinical effect at a specific concentration
File history
Click on a date/time to view the file as it appeared at that time.
| Date/Time | Thumbnail | Dimensions | User | Comment | |
|---|---|---|---|---|---|
| current | 15:20, 10 March 2023 | | 768 × 440 (85 KB) | Nikolas (talk | contribs) |
You cannot overwrite this file.
File usage
The following page uses this file: