File:Concentration-response curve.png
No higher resolution available.
Concentration-response_curve.png (768 × 462 pixels, file size: 175 KB, MIME type: image/png)
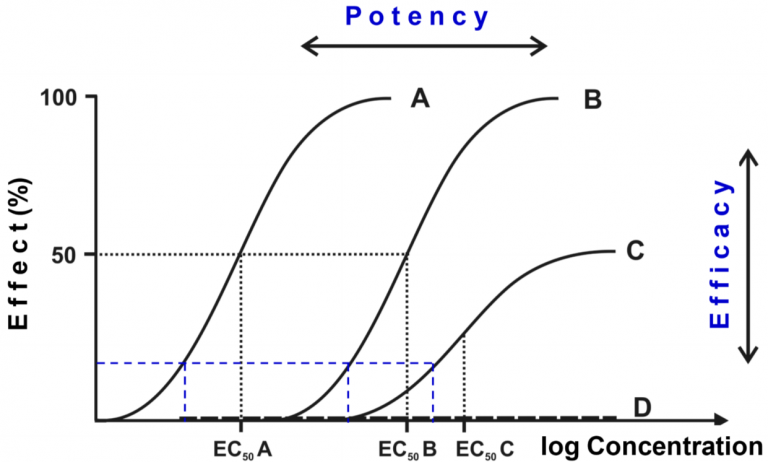
A concentration-response curve. The axes are the same as in the previous figure. The four curves A, B, C and D show the concentration-response relationship of four different drugs. The EC50 of them can be seen. Drugs A, B and C are agonists. D is an antagonist, which is why it doesn’t give a response no matter the dose.
File history
Click on a date/time to view the file as it appeared at that time.
| Date/Time | Thumbnail | Dimensions | User | Comment | |
|---|---|---|---|---|---|
| current | 15:21, 10 March 2023 | | 768 × 462 (175 KB) | Nikolas (talk | contribs) |
You cannot overwrite this file.
File usage
The following page uses this file: